All Categories
History
Product
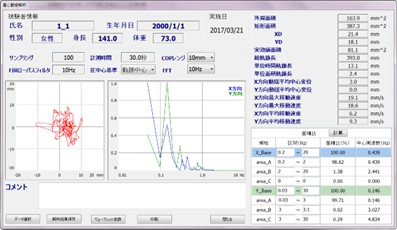
Numerical data analysis/visualization Peak analysis software PeakFitHandling Company
Hulinks Co., Ltd.Categories
| Image | Part Number | Price (excluding tax) | Operating environment CPU | Operating environment HDD | Operating environment OS | Operating environment RAM |
|---|---|---|---|---|---|---|
PeakFit 4.11 |
Available upon quote |
Pentium or equivalent compatible processor or higher |
10MB or more |
Windows 95/98/NT4/2000/XP/Vista/7/8.x/10 |
32 MB or more recommended |
Reviews shown here are reviews of companies.