All Categories
History
Price (excluding tax)
You can search for other models from each index. The displayed value is the value of the currently selected part number.
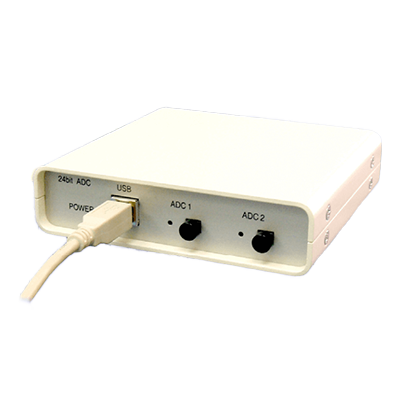
ADC resolution
Calibration curve
Compatible OS
Excel/CSV output function 1
Excel/CSV output function 2
Help log function
Identification
Input voltage
Language
Measurement
Memory
Number of input channels
Number of peaks that can be processed
Quantitative calculation method 1
Quantitative calculation method 2
Report creation function
Sap ring spacing
Specimen chromatography function
Waveform data 1
Waveform data 2
Waveform processing 1
Waveform processing 2
Part Number
CDS-plus ver5.0Handling Company
L.A.Soft Co., Ltd.| Image | Price (excluding tax) | ADC resolution () | Calibration curve () | Compatible OS () | Excel/CSV output function 1 () | Excel/CSV output function 2 () | Help log function () | Identification () | Input voltage () | Language () | Measurement () | Memory () | Number of input channels () | Number of peaks that can be processed () | Quantitative calculation method 1 () | Quantitative calculation method 2 () | Report creation function () | Sap ring spacing () | Specimen chromatography function () | Waveform data 1 () | Waveform data 2 () | Waveform processing 1 () | Waveform processing 2 () |
|---|---|---|---|---|---|---|---|---|---|---|---|---|---|---|---|---|---|---|---|---|---|---|---|
|
|
Available upon quote | 24bit | Calculate calibration curves using straight lines, curves, and polygonal lines up to 32 points using the least squares method. Origin processing can be set to easily evaluate the validity of the calibration curve using the coefficient of determination. Calibration curves can be displayed graphically and weighted calibration curves can be created. | Windows11,10, 8, 7 (Vista, XP is compatible with B431 or earlier) | Data exchange with EXCEL is possible using the simple Excel button Analysis results, waveform information, and waveform voltage values can be output in CSV format (text format), and multiple data can be converted at once. | Waveforms and calculation results can be pasted using the clipboard copy function. | HTML context-sensitive help with F1 key for explanation Search function allows you to search by keyword etc. Collects logs such as program status and error messages to support unexpected conditions such as abnormal termination. | Over 500 peaks to be identified, manual identification function for specific peaks Identification by absolute and relative retention times Identification mode can be specified for grouping and individual peaks | ±1.25V (clipped to -25mV~+1V by software) | Japanese version and English version (switchable) | Measurement can be started using a start signal from an autosampler, etc. File names are automatically numbered and continuous measurements are possible. | 2GB or more, CPU with 2 cores or more recommended | 2ch Can be expanded up to 8ch | 500 or more | Simple percentage method (area and height can each be used), modified percentage method, absolute calibration curve method, internal standard method, index calculation method | Automatically calculates major calculation items such as Rt, concentration, area, height, NTP, peak width, resolution, and symmetry, and allows you to set simple calculation formulas. | A4, B4, 10-inch continuous paper, etc. can be used. Print format can be changed arbitrarily using the mouse. Multiple waveform data (up to 8) can be printed simultaneously on one sheet, saving recording paper. | 10ms | During measurement, the standard chromatogram waveform that has already been measured can be displayed overlaid as a sample chromatogram. | Waveform information, component information notes, and additional information that can be defined by the user can be managed in a unified manner using a uniquely developed DFM format data file. Store various conditions related to data processing in a unique method file | Analysis method can be selected according to conditions Long file names can be used for waveform data names | Automatic peak search using waveform analysis parameters Can respond to complex waveforms using time programs, and can handle shoulder and negative peaks. | Interactive modification of manual waveform processing using the mouse Baseline correction using differential chromatography Baseline subtraction function |
Reviews shown here are reviews of companies.